ĐỒ ÁN TỐT NGHIỆP SỬ DỤNG PHẦN MỀM ETAP ĐỂ MÔ PHỎNG PHÂN BỐ CÔNG SUẤT VÀ NGẮN MẠCH TRONG HỆ THỐNG ĐIỆN
GRATITUDE
First, we would like to express sincere thanks to the university authority, the teachers in HCMC University of Technology, especially teachers in the Faculty of Electrical and Electronics Engineering for providing us all the necessary facilities and knowledge.
We are highly indebted and thoroughly grateful to Ph.D. Nguyen Van Liem for being ever so kind to show interest in our procedure and for giving precious advices regarding to the topic of our project.
To all relatives, friends and others who willing to share their information about this topic and many new ideas about task which required us to work together in order to complete the research, thank you.
At last, we have attempted to analyze aggregated and refer to some electrical materials to achieve the best results. However, due to the limited of time and references, the shortcomings are inevitable; we respectfully receive the comments and the contributions from you for improvement.
TABLE OF CONTENTS
CHAPTER 1: INTRODUCTION
1.A. Overview of ETAP ........................................................................ Page 05
1.B. Basic contents of system ............................................................. Page 06 CHAPTER 2: SETTING 9 BUS SYSTEM
Abstract of this chapter ..................................................................... Page 20
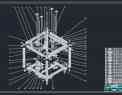
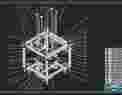
2.A. Modeling 9 BUS system ……......................................................... Page 20
2.B. Understanding data table and data format ………........................ Page 21 Conclusion of this chapter .................................................................. Page 21
CHAPTER 3: IEEE 9 BUS LOAD FLOW ANALYSIS
Abstract of this chapter ..................................................................... Page 23
3.A. Synchronous Generators ….......................................................... Page 23
3.B. Transformers ............................................................................... Page 25
3.C. Transmission Lines ...................................................................... Page 27
3.D. Static Loads ................................................................................. Page 28
3.E. Running and Creating Report ...................................................... Page 29
Conclusion of this chapter .................................................................. Page 29 CHAPTER 4: APPYLING THE PROCESS FOR IEEE 14 BUS TEST SYSTEM
Abstract of this chapter ..................................................................... Page 33
4.A. Modeling and understanding data ............................................. Page 33
4.B. Running and Creating Report …………………………………………………. Page 34 Conclusion of this chapter ................................................ ............... Page 34
CHAPTER 5: IEEE 9 BUS SHORT CIRCUIT ANALYSIS
Abstract of this chapter ..................................................................... Page 36
5.A. Synchronous Generators ............................................................ Page 36
5.B. Transmission Lines ………………………….......................................... Page 37
5.C. Transformers …………................................................................... Page 38
5.D. Running and Creating Report ..................................................... Page 39
Conclusion of this chapter ................................................................. Page 39
CHAPTER 6: COMMENTS AND CONCLUSION ............................................... Page 44 REFERENCES .................................................................................................. Page 45
I. INTRODUCTION
Operating an electrical system economically and efficiently is a desirable goal.Inthepowersystem,powerismobilizedfromvarioussourcesandscatteredin different locations, to reach the destination through the loss of transmission. Each power source has different power generation costs, so the most economical goal is to achieve the most efficient distribution of power between the most economical power sources. The optimal power distribution to achieve different targets such as cost savings in electricity generation, reduction of power losses, keeping voltage at the desired limits and so forth. By various measures such as capacity changes transmission source, adjustable transformer voltage divider, change capacitor capacitors,synchronouscompensator.ThemoduleinETAP12.6.0helpsanalyzethe find the best case quickly with a variety of goals. In this report, using the IEEE 9- bus and IEEE 14-bus model to simulate power flow and short-circuit from input parameters step to showingresults.
A. Overview ofETAP:
ETAP is a program for many operating systems. It allows making changes to the single-line diagram, running system studies, and graphically reviewing study results.
ETAP has been designed and developed by engineers for engineers to handle the diverse discipline of power systems for a broad spectrum of industries in one integratedpackagewithmultipleinterfaceviewsuchasACandDCnetwork,cable raceway, ground gird, GIA, panels, arc flash, WTG, protective device coordination/selectivity, and AC, DC control systemdiagrams.
ETAP gives the opportunity to explore the many features and capabilities including Load Flow, Short-Circuit, and Underground Raceway Systems analysis, MotorAcceleration,Harmonics,TransientStability,DeviceCoordination,Optimal Power Flow, Reliability Assessment, DC Load Flow, DC Short-Circuit, Battery Sizing and Discharge, Ground Grid Systems, Transformer MVA Sizing, Transformer Tap Optimization, Parameter Estimation, and Cable PullingSystems.
B. Basic contents ofsystem:
- BUS
A bus is defined as a point (node) where one or more branches are connected. A branch could be a cable, transformer…
· Informationpage:
- PageID
The assigned IDs consist of the default bus ID plus an integer, starting with the number one and increasing as the number of buses increase
- NominalkV
Enter the nominal voltage of the bus in kilovolts (kV). This input is a required entry, which is used by ETAP to convert the final bus voltages to the actual values forgraphicaldisplayandoutputreports,i.e.,busnominalkVisusedasthebasekV for the reported percentvoltages.
- InitialkV
Enter the magnitude of the bus voltage in kV. The %V is calculated if the Nominal kV has already been entered. This value is used the same as %V.
- 3Phase
Three-phase and single-phase loads can be connected to this bus. Single-phase branches must be connected through a phase adapter before connecting to a three- phase bus.
- 1 Phase3W
3W indicates Hot-Neutral-Hot for center tapped connections. Only single-phase devices can be connected to this bus.
· Phase Vpage:
- %LVUR
Line Voltage Unbalance Rate. This is the maximum voltage deviation from the average line voltage in percent.
- %PVUR
Phase Voltage Unbalance Rate. This is the maximum voltage deviation fromthe average phase voltage inpercent.
- %VUF
Voltage Unbalance Factor. This is a negative sequence to positive sequence voltage ratio in percent.
· Loadingpage:
The Load page is used to display the total Constant kVA, Constant Z, Constant
- ThedisplayedkWandKVAR(orMWandMVAR)indicatethealgebraicsumof the operating load of all loads that are either directly connected to the bus or connected through composite networks, composite motors, or powerpanels.
· Motorpage:
The Motor/Generator Page displays each individual induction motor, synchronous motor, and generator that is directly connected to the bus you are editing. The motors displayed on this page can be located inside a compositemotor that is directly connected to thebus.
· Ratingpage:
ANSI
Select this option if the bus is rated under ANSI Standards. By selecting this option, the bus bracing will change to ANSI standard fields.
IEC
Select this option if the bus is rated under IEC Standards. By selecting this option, the bus bracing will change to IEC standard fields.
· Reliability:
Aisparameterisdefinedastheactivefailurerateinnumberoffailuresper year. Variable “m” is The Mean repair rate in number of repairs per year, calculated automatically based on MTTR (m =8760/MTTR).
MTTF: The Mean Time to Failure in years calculated automatically based on lA (MTTF = 1.0/lA).
FOR: Forced Outage Rate (i.e., unavailability) calculated based on MTTR, lA (FOR = MTTR/(MTTR+8760/lA).
· Remarkpage:
The remarks page is common to all element editors.
UD Field 1, UD Field 2, UD Field 3, UD Field 4, UD Field A5, UD Field A6, UD Field A7. These fields allow you to keep track of extra data associated with this component. The names of the User-Defined (UD) fields can be changed from the Settings option in the Project menu in the Menu bar.
2. PowerGrid:
A power grid is represented with its Thevenin’s equivalent, a constant voltage source behind a short-circuit impedance. There include pages’ properties: Info, Rating, Short circuit, harmonic, reliability, Energy price, remark, comment.
· Infopage:
ID:EnteringauniqueID,ETAPautomaticallyassignsauniqueIDtoeachpower grid. The assigned IDs consist of the default power grid ID plus an integer, starting with the number one and increasing as the number of power grids increase. The default power grid ID (U) can be changed from the Defaults Menu in the menu bar or from the ProjectView.
Bus:ThisistheIDoftheconnectingbusforthepowergrid.Iftheterminalisnot connected to any bus, a blank entry will be shown for the bus ID. To connect or reconnectapowergridtoabus,selectabusfromthelistbox.Theone-linediagram will be updated to show the new connection after you clickOK.
If a power grid is connected to a bus through a number of protective devices, reconnection of the power grid to a new bus from the editor will reconnect the last existing protective device to the new bus, as shown below where Gen1 is reconnected from Bus10 to Bus4.
· Connection:
The phase connection for the power grid can be defined by selecting 3 Phase or 1 Phase (AN). The default connection is 3 Phase. The phase connection must be specified before connecting the power grid to any device. Once the power grid is connectedtoadevice,thephaseconnectionselectionswillbegrayed-out.Tochange theconnectiontype,youneedtodisconnectthepowergridfromalldevices.
- 3Phase
Select to define the power grid as a three-phase source.
- 1Phase
Select this to define the power grid as single-phase source. Only single-phase devices can be connected to this source. Note that the connection available is Phase A.
- Service
The operating condition can be set by clicking on the radio buttons for either. In Service or Out of Service. The engineering properties within the editor of an Out of Service element can be edited like a service element; however, an Out of Service element will not be included in any system studies. When the continuity check is activated, an Out of Service element is automatically color coded with the de- energized color (theme manager). The default color for a de-energized element is grey.
· Rating:
- RatedkV
Enter the rated voltage of the power grid in kilovolts (kV). This entry is used by ETAP to convert the utility short-circuit MVA to percent short-circuit. This valueis also used as the power grid base kV. Base voltages are calculated by ETAP beginning with the swing systems (swing power grids and/or swing generators) and continuingfortherestofthesystem,usingtheratedkVofthetransformerwindings.
- GenerationCategories
This group is used to assign the different power settings to each of the ten generation categories for this power grid. Each grid can be set to have a different operating power level for each generation category. Depending on the operation mode, some of the values become editable as follows:
Swing Mode: %V and angle Voltage Control Mode: %V and MW MVAR Control: MW and MVAR Power Factor Control: MW andPF
- % V (VoltageMagnitude)
Enter the magnitude of the power grid voltage as a percentage of the power grid nominal kV. This % operating voltage is used as the control (regulated) value for swing and voltage control modes. This value is used as an initial operating voltage for MVAR control power grids.
- V angle (VoltageAngle)
Enter the angle of the power grid voltage in degrees. This value is used as a reference angle for power grids in swing mode. This value is used as an initial operating voltage angle for MVAR control power grids.
- MW/kW
Enterthemegawatt/kilowattgeneration(realpowersupply)fromthepowergrid. ThisfieldisprovidedforvoltagecontrolledandMVARcontrolledpowergrids.This value will be held fixed for load flowsolutions.
- MVAR/KVAR
EntertheMVARgeneration(reactivepowersupply)fromthepowergrid.Thisfield is provided for MVAR controlled power grid types only. This value will be held fixed for load flowsolutions.
- %PF
This is the power factor setting of the power grid. This column is editable forPF controlled grid types only. This value will be held fixed for load flowsolutions.
- QMax andQMin
These entries specify the maximum and minimum limits for reactive power generation in MVAR/KVAR. These limits are required for voltage regulated power grid types only and should be obtained from the capability curve (MVAR vs. MW), i.e., the Max and Min MVAR limits should correspond to the specified MW generation.IfthevalueofthecalculatedMVARfallsoutsidethisrange,thevalueis fixed at the limit and the power grid type is changed to MVARcontrol.
- Operating
Basedonthelatestloadflowrun,theoperatingvoltagemagnitude,voltageangle, MW and MVAR are displayed here; or, you may enter the operating voltage magnitude,voltageangle,MWandMVAR.ETAPwillutilizethesefieldsdepending ontheoperatingmodeofthePowerGrid.See“Mode”underthe“PowerGrid-Info page”.
· Harmonic:
- Library: Click the Library button to bring up the Harmonic Library Quick Pick Editor.
- From the Harmonic Library Quick Pick Editor, pick a manufacturer name and a modelname.
- Type: This displays the harmonic sourcetype.
- Manufacturer: the selected manufacturer names from the harmoniclibrary.
- Model: the selected model names for the selected manufacturer from the harmoniclibrary.
- Wave Form: Choosing to present the current waveform of the selectedharmonic library in timedomain.
- Print (Wave Form): This prints the harmonicwaveform.
- Spectrum:theharmonicspectrumoftheselectedharmoniclibrary.Andafterthat Print(Spectrum)
· Reliability:
- Reliability Parameters Variable“lA”
Thisparameterisdefinedastheactivefailurerateinnumberoffailuresperyear. Theactivefailurerateisassociatedwiththecomponentfailuremodethatcausesthe operation of the primary protection zone around the failed component. Therefore, this setting can cause the removal of other healthy components and branches from service. After the actively failed component is isolated, the protection breakers are recluse. This leads to service being restored to some or all of the load points. Note, however, that the failed component itself (and those components that are directly connected to this failed component) can be restored to service only after repair or replacement.
Variable “m”
The Mean repair rate in number of repairs per year, calculated automatically based on MTTR (m = 8760/MTTR).
- MTTF
The Mean Time To Failure in years calculated automatically based on lA (MTTF = 1.0/lA).
- FOR
Forced Outage Rate (i.e., unavailability) calculated based on MTTR, lA (FOR = MTTR/(MTTR+8760/lA).
- MTTR
This is the Mean Time to Repair in hours. It is the expected time for a crew to repair a component outage and/or restore the system to its normal operating state.
3. TransmissionLine:
· Info page:
In the Info page, the user can specify the transmission line ID, From and To bus ID and kV, In/Out of Service, Feeder Tag, Name, Description, and Length.
- ID
Enter a unique ID with up to 25 alphanumeric characters. ETAP automatically assigns a unique ID to each transmission line.
- From andTo
BusIDsfortheconnectingbusesofatransmissionlinearedesignatedas“From” and “To” buses. If a terminal of a branch, “From” or “To”, is not connected to any bus, a blank entry will be shown for busID.
For3PhaseTransmissionLines,only3Phasebuseswillbedisplayedinthedrop downlists.ForSingleTransmissionLinesonlysingle-phasebuseswillbedisplayed.
Single Phase Transmission lines can also be connected to Phase Adapters. If the Cable is connected as such, then the Phase Adapter ID will show in the Primary or Secondary field.
- Connection
Transmission Lines can be defined as 3 Phase or 1 Phase lines by selecting any of the following selections:
- 3Phase
Define the line as a three-phase line. This line can be connected only to three- phase buses.
- 1Phase
Define the line as a single-phase line.
- Length
Enter the length of the transmission line, in the units specified in the Unit field.
- Unit
Select the unit from the list box. The units of length available are feet, miles, meters, and kilometers.
· Parameterpage:
In the parameter page the user can select the Phase and ground conductors from the library or enter the conductor properties.
- ConductorType
Select the main conductor material (Copper or Aluminum).
- RT1
This is the phase conductor rated resistance at the rated temperature T1 in ohms per mile or ohms per kilometer.
- RT2
This is the phase conductor rated resistance at the rated temperature T2 in ohms per mile or ohms per kilometer.
- Xa
Enter the conductor inductive reactance in ohms per mile at 1ft spacing or ohms per kilometer at 1 ft spacing.
- OutsideDiameter
Specify the conductor outside diameter in inches or cm. ETAP calculates the equivalentdiameterofthebundledconductors(d’)byusingthefollowingformulas:
Two bundled conductors:
Three bundled conductors:
Four bundled conductors:
where d is a single conductor diameter in inches and S is the separation between conductors in inches or cm.
- GMR
Specify the conductor geometric mean radius (GMR) in feet or meters. GMR must be less than or equal to the conductor radius. When Xa is entered and GMR hasnotbeenentered,theprogramwillcalculateGMRusingthefollowingformula:
For English units:
For Metric units:
For bundled conductors, ETAP calculates the equivalent GMR using the following formulas:
+Two bundled conductors:
+Three bundled conductors:
Four bundled conductors:
Where GMR is for a single conductor and S is the separation between bundled conductors in inches or cm.
· Configurationpage:
In the configuration page, the user can specify the physical configuration of the transmission line. Configuration Type: the user selects the configuration:
+ Horizontal
+ Vertical
+ Triangular
+ Parallel Vertical
+Parallel Horizontal
+ General
The general configuration allows user to specify the physical location of the conductors with respect to a reference point. The reference point is located at the same level as the base of the tower or pole. This defines the height of the lineswith respect to the soil level. Forexample:
- GMD
The geometric mean diameter (GMD) is calculated based on the spacing and configuration type. The value is in feet or meters.
- Phase Height
Enter the height (in feet or meters) of the transmission line from Earth to the highest conductor in the system.
Spacing
Specify the distance between the phase conductors as three pairs of conductors (AB, BC, CA) in feet or meters. This provides the ability to configure the wires to almost any shape. For parallel circuits, you need to specifythe distance between the two circuits. ETAP treats the triangular and parallel configurations symmetrically (that is, AB = BC andCA<(AB+BC)).
This field is dimmed when General is selected for the Configuration Type. in this case, the fields are calculated based on the X,Y coordinates of the conductors.
· Impedancepage:
Pos., Neg., a
........................................................................
|
Bus 3 |
- |
59.660 |
40.675 |
56.723 |
|
Bus 4 |
- |
0 |
2.241 |
2.241 |
|
Bus 5 |
- |
0 |
1.762 |
1.762 |
|
Bus 6 |
- |
0 |
1.687 |
1.687 |
|
Bus 7 |
- |
0 |
2.349 |
2.349 |
|
Bus 8 |
- |
0 |
1.937 |
1.937 |
|
Bus 9 |
- |
0 |
2.155 |
2.155 |
|
Ik (Steady State S.C Current kA, rms) |
||||
|
|
3 Phases |
L-G |
L-L |
L-L-G |
|
Bus 1 |
46.036 |
67.037 |
44.922 |
59.229 |
|
Bus 2 |
46.767 |
60.710 |
41.426 |
57.730 |
|
Bus 3 |
45.991 |
59.660 |
40.675 |
56.723 |
|
Bus 4 |
2.473 |
0 |
2.241 |
2.241 |
|
Bus 5 |
1.984 |
0 |
1.762 |
1.762 |
|
Bus 6 |
1.901 |
0 |
1.687 |
1.687 |
|
Bus 7 |
2.665 |
0 |
2.349 |
2.349 |
|
Bus 8 |
2.205 |
0 |
1.937 |
1.937 |
|
Bus 9 |
2.445 |
0 |
2.155 |
2.155 |
TRANSIENT MODE
|
I’’k (Initial Symmetrical S.C Current kA, rms) |
||||
|
|
3 Phases |
L-G |
L-L |
L-L-G |
|
Bus 1 |
39.344 |
61.968 |
41.026 |
51.923 |
|
Bus 2 |
34.165 |
53.387 |
35.440 |
44.926 |
|
Bus 3 |
|
|
|
|
|
Bus 4 |
2.219 |
0 |
2.120 |
2.120 |
|
Bus 5 |
|
|
|
|
|
Bus 6 |
|
|
|
|
|
Bus 7 |
|
|
|
|
|
Bus 8 |
|
|
|
|
|
Bus 9 |
|
|
|
|
|
Ip (Peak S.C Current, kA, Method C) |
||||
|
|
3 Phases |
L-G |
L-L |
L-L-G |
|
Bus 1 |
104.294 |
164.265 |
108.751 |
137.636 |
|
Bus 2 |
91.013 |
142.219 |
94.409 |
119.679 |
|
Bus 3 |
|
|
|
|
|
Bus 4 |
5.751 |
0 |
5.494 |
5.494 |
|
Bus 5 |
|
|
|
|
|
Bus 6 |
|
|
|
|
|
Bus 7 |
|
|
|
|
|
Bus 8 |
|
|
|
|
|
Bus 9 |
|
|
|
|
|
Ib (Breaking S.C Current, kA) |
||||
|
|
3 Phases |
L-G |
L-L |
L-L-G |
|
Bus 1 |
- |
67.037 |
44.922 |
59.229 |
|
Bus 2 |
- |
53.387 |
35.440 |
44.926 |
|
Bus 3 |
|
|
|
|
|
Bus 4 |
- |
0 |
2.120 |
2.120 |
|
Bus 5 |
|
|
|
|
|
Bus 6 |
|
|
|
|
|
Bus 7 |
|
|
|
|
|
Bus 8 |
|
|
|
|
|
Bus 9 |
|
|
|
|
|
Ik (Steady State S.C Current kA, rms) |
||||
|
|
3 Phases |
L-G |
L-L |
L-L-G |
|
Bus 1 |
39.344 |
61.968 |
41.026 |
51.923 |
|
Bus 2 |
34.165 |
53.387 |
35.440 |
44.926 |
|
Bus 3 |
|
|
|
|
|
Bus 4 |
2.219 |
0 |
2.120 |
2.120 |
|
Bus 5 |
|
|
|
|
|
Bus 6 |
|
|
|
|
|
Bus 7 |
|
|
|
|
|
Bus 8 |
|
|
|
|
|
Bus 9 |
|
|
|
|
EQUIVALENT MODE
|
I’’k (Initial Symmetrical S.C Current kA, rms) |
||||
|
|
3 Phases |
L-G |
L-L |
L-L-G |
|
Bus 1 |
12.574 |
29.327 |
18.022 |
18.487 |
|
Bus 2 |
|
|
|
|
|
Bus 3 |
|
|
|
|
|
Bus 4 |
0.952 |
0 |
1.234 |
1.234 |
|
Bus 5 |
|
|
|
|
|
Bus 6 |
|
|
|
|
|
Bus 7 |
|
|
|
|
|
Bus 8 |
|
|
|
|
|
Bus 9 |
|
|
|
|
|
Ip (Peak S.C Current, kA, Method C) |
||||
|
|
3 Phases |
L-G |
L-L |
L-L-G |
|
Bus 1 |
34.057 |
79.435 |
48.813 |
50.073 |
|
Bus 2 |
|
|
|
|
|
Bus 3 |
|
|
|
|
|
Bus 4 |
2.551 |
0 |
3.310 |
3.310 |
|
Bus 5 |
|
|
|
|
|
Bus 6 |
|
|
|
|
|
Bus 7 |
|
|
|
|
|
Bus 8 |
|
|
|
|
|
Bus 9 |
|
|
|
|
|
Ik (Steady State S.C Current kA, rms) |
||||
|
|
3 Phases |
L-G |
L-L |
L-L-G |
|
Bus 1 |
12.574 |
29.327 |
18.022 |
18.487 |
|
Bus 2 |
|
|
|
|
|
Bus 3 |
|
|
|
|
|
Bus 4 |
0.952 |
0 |
1.234 |
1.234 |
|
Bus 5 |
|
|
|
|
|
Bus 6 |
|
|
|
|
|
Bus 7 |
|
|
|
|
|
Bus 8 |
|
|
|
|
|
Bus 9 |
|
|
|
|
Conclusion
The results of the short circuit study are summarized in a Device Evaluation Table providing the short circuit available and the rating of the equipment then denoting a pass or fail for the device.
I. COMMENTS ANDCONCLUSION
- LOAD FLOWANALYSIS
ü Adjusting the transmitter range exceeding 100% of the rated capacity to increase transmission voltage, reduced voltage drop on theline.
ü Loss on the line voltage is less than5%.
- SHORT CIRCUITANALYSIS
ü The result at the super-transitional mode of the generator are influenced by the super-transitionalresistanceofthemotorandthegenerator.Thesuper-transitional resistance usually apply for the generator and the transitional resistance usually apply for the synchronous machine for determining the capability cut-off of the machine
ü Accordingtothewire-connectedY/∆,ZN→∞.Byusingtheformulashortcircuit onephaseconnecttothegroundINa=0=I¬Nb=I¬Nc;atthesametime,byusing theformulaoftheshortcircuitapplyingonthetwophaseconnectedtotheground, INa = 0 but I¬Nb = I¬Nc ≠0
ü Besides that, we realize that the order flow does not exist in the primary side Y becauseofthegroundwire.Weneedtopayattentionontheorderflowzeroonthe primary side ∆ could not receive at the terminals of the delta ∆ - circuit. So, the order current is not equal 0 at Bus 1, 2,3
ü vertheshort-circuitproblem,wealsohavethevalueofthebiggestshort-current, short circuit run on the line to protect therelay.